With names like Russell Westbrook, Jrue Holiday and Zach Levine, UCLA are looking to capture the magic of yester-year and capitalize on their success from their previous seasons in the NCAA tournament.
In preseason the Bruins were predicted to be a top 10 team and have been up to the task so far. Heading into this week’s matchup against Oregon, the Bruins are currently ranked no. 7 in the Associated Press poll. They recovered well from their recent loss to crosstown rival USC, with wins over Washington and Washington State.
The Pac-12 schedule continues this week in Oregon. #GoBruins 🏀🛬 pic.twitter.com/uv1EBmzqoy
— UCLA Men’s Basketball (@UCLAMBB) February 9, 2023
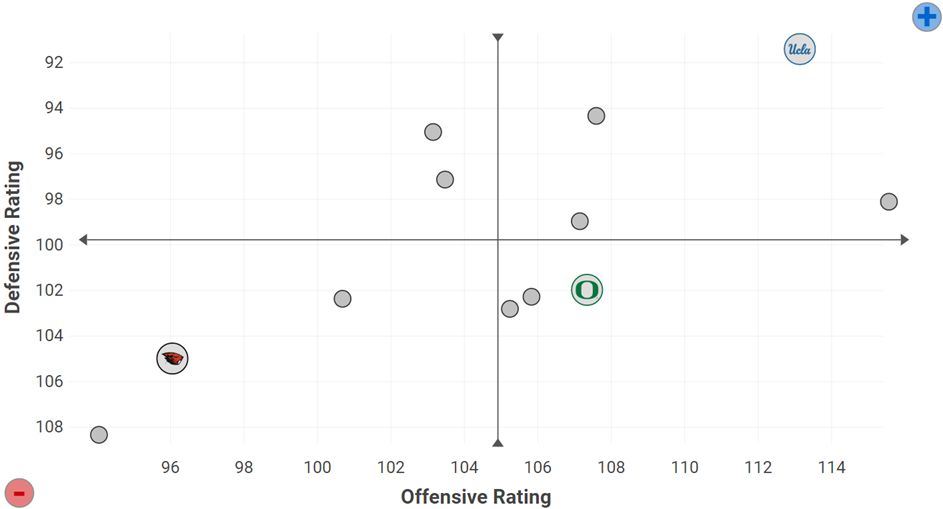
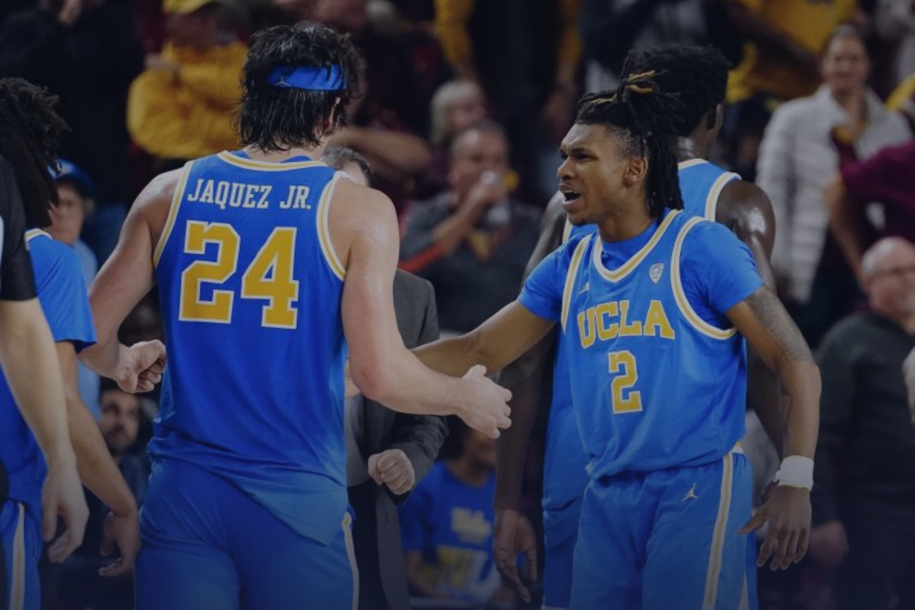
This year’s team is returning four of their top scorers from last year’s sweet 16 team: Jamie Jaquez Jr (16.3 PPG, 7.7 RPG), Tyger Campbell (13.2 PPG, 4.9 APG), David Singleton (10.3 PPG, 3.2 RPG) and Jaylen Clark (13.1 PPG, 6.8 RPG). With players like Jaquez Jr and Clark who were Pac-12 All-Defensive Team last year, it is no wonder UCLA is rated in the Top 3 in defensive rating, per Kenpom stats.
With the regular season heating up, we’ve looked at how the Bruins match up by the numbers with their Northwest opponents from the state of Oregon ahead of two important games this week.
State of play: UCLA, Oregon and Oregon State
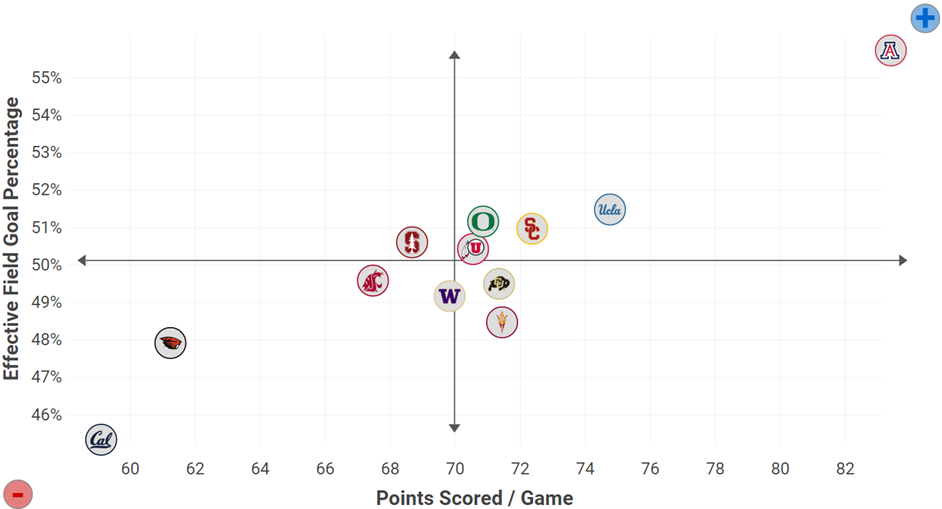
The Bruins are coming in with a 110.8 in offensive rating, averaging 74.7 PPG. On average, their assists per game is 15 and they’re grabbing 12.2 offensive rebounds per game. Their adjusted offensive efficiency is at 115.8, behind only Arizona in the Pac-12.

The Oregon Ducks are a solid squad, averaging 70.8 PPG, with an offensive rating of 105.2. They average 13.3 assists per game and clean up the offensive glass with 10.9 rebounds per game. The Ducks are in the mix in the Pac-12, with a solid foundation built on an adjusted offensive efficiency of 113.6.
The Oregon State Beavers, on the other hand, are having a challenging season thus far. They’re sat near the bottom of the table in conference play, with an offensive rating of 94.6 and an adjusted offensive efficiency of 100.8. They’re averaging just 62 points, 10.8 assists and 7.3 offensive rebounds per game. Needless to say, the Beavers are not in a great position heading into this next round of games.
Starting five: How do UCLA, Oregon and Oregon State compare?
The Bruins starters average a combined 61.4 PPG and 25.2 RPG. As a unit, they’re shooting above 50%, with a 56.9% true shooting rate. Those sorts of numbers will put a huge amount of pressure on opposing teams to be near-flawless in defense.
The starting five for the Ducks doesn’t fare as well. They average fewer points per game (49.1), fewer rebounds per game (19.9) and have a worse true shooting percentage (53.3%). The same outcome can be said for the Beavers who – despite a higher usage rate than both UCLA and Oregon – average just 43.7 points per game.

It’s clear that these offensive metrics favor the Bruins. UCLA has played at least eight different starting lineups this season, compared to Oregon and Oregon State’s four.
Verdict: Bruins defense will be key
UCLA appears to have a clear advantage over the Oregon State Beavers, also outpacing the Oregon Ducks statistically.
On paper, the UCLA Bruins have an advantage and will be the betting the favorites in each game. If the tenacious UCLA defense continue to handle the opposition, they’ll be able to avoid extended minutes without offensive continuity and a lackluster scoring output, which has hampered them in previous games.
Will Oregon State be able to provide the upset of the year? Oregon already has a victory over a very good Arizona team, can they pull another victory over a ranked opponent?
Based on the numbers, UCLA should be able to score enough points and defend to walk away with two victories. However, UCLA can struggle offensively at times, leaving teams within striking distance. If a player can get hot like USC’s Boogie Ellis there could be an upset looming.

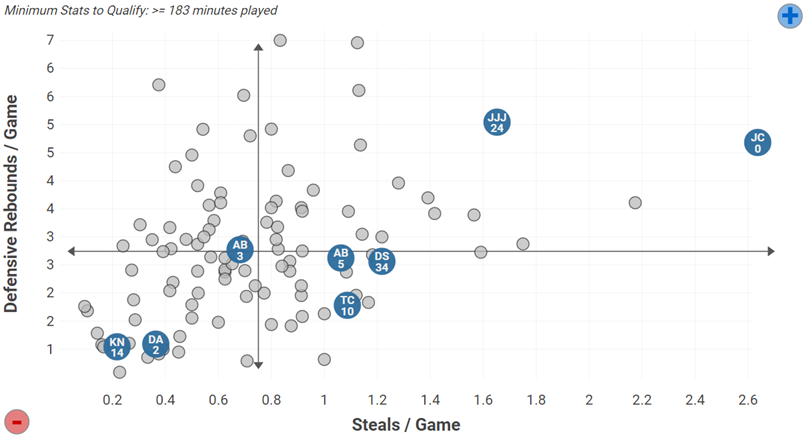
In spite of all this, UCLA ranks among the best defensively. With two All-PAC-12 defenders, they make it extremely tough on offenses. They only allow 60.3 PPG, averaging 8.8 steals per game. The Bruins can always rely on their defense when the offense struggles.
Statistics can provide great insight heading into games. But if this season has taught us anything, it’s that NCAA basketball is not played on paper.

4 Comments
The ultimate solution to generate massive TikTok traffic and leads!
Make Up To $1,000 Every Day with GPTOK – https://bit.ly/3XKeRzB
https://www.bet-promokod.ru
Букмекерская контора 1xBet является одной из самых популярных на рынке. https://bet-promokod.ru/ Большой выбор событий из мира спорта и киберспорта, множество открытых линий, самые высокие коэффициенты. Кроме того, БК имеет широкий функционал и одна из немногих дает возможность совершать ставки по специальным промокодам. Используя промокоды, вы можете получить реальный денежный выигрыш, не внося абсолютно никаких средств. Это реально! Узнать последний промокод вы можете прямо сейчас, однако использовать его необходимо в соответствии с правилами и инструкциями, которые приведены ниже.
Cel mai bun cod de recomandare Binance
Can you be more specific about the content of your article? After reading it, I still have some doubts. Hope you can help me.
Code of your destiny
I’m extremely inspired with your writing abilities and also with the structure for your weblog. Is this a paid subject matter or did you customize it yourself? Either way keep up the nice high quality writing, it is uncommon to peer a nice weblog like this one today!